Demographics of Nova Scotia
Nova Scotia (Latin for New Scotland; French: Nouvelle-Écosse; Scottish Gaelic: Alba Nuadh) is a Canadian province located on Canada's southeastern coast. It is the most populous province in the Atlantic Canada, and its capital, Halifax, is a major economic centre of the region. Nova Scotia is the second smallest province in Canada, with an area of 55,284 km². Its population of 1,072,545 (as of 2024)[1] makes it the fourth least populous province of the country.
Population
Nova Scotia is the seventh most populous province in Canada with an estimated 1,079,627 residents as of 2025. It accounts for 2.6 percent of the population of Canada.[2] The population density is approximately 20.4 persons/km². Roughly 60% of the population live in rural parts of the province.
Regional municipalities
Nova Scotia has four regional municipalities.
| Name | Population (2021)[3] |
Population (2016)[3] |
Change (%)[3] |
Area (km²)[3] |
Population density[3] |
|---|---|---|---|---|---|
| Cape Breton | 93,694 | 94,285 | −0.6% | 2,419.70 | 38.7 |
| Halifax | 439,819 | 403,131 | +9.1% | 5,475.57 | 80.3 |
| Queens | 10,422 | 10,302 | +1.2% | 2,387.52 | 4.4 |
| West Hants | 19,509 | 19,016 | +2.6% | 1,250.5 | 15.6 |
| Total regional municipalities | 563,444 | 526,734 | +7.0% | 11,533.29 | 48.85 |
Towns
Nova Scotia has 25 towns.
| Towns of Nova Scotia | |||||||
|---|---|---|---|---|---|---|---|
| Name | 2021 Census of Population[3] | ||||||
| Population (2021) |
Population (2016) |
Change |
Land area (km²) |
Population density | |||
| Amherst | 9,404 | 9,413 | −0.1% | 12.07 | 779.1/km2 | ||
| Annapolis Royal | 530 | 491 | +7.9% | 1.98 | 267.7/km2 | ||
| Antigonish | 4,656 | 4,364 | +6.7% | 4.98 | 934.9/km2 | ||
| Berwick | 2,455 | 2,509 | −2.2% | 6.53 | 376.0/km2 | ||
| Bridgewater | 8,790 | 8,532 | +3.0% | 13.63 | 644.9/km2 | ||
| Clark's Harbour | 725 | 758 | −4.4% | 2.82 | 257.1/km2 | ||
| Digby | 2,001 | 2,060 | −2.9% | 3.16 | 633.2/km2 | ||
| Kentville | 6,630 | 6,271 | +5.7% | 17.08 | 388.2/km2 | ||
| Lockeport | 476 | 531 | −10.4% | 2.32 | 205.2/km2 | ||
| Lunenburg | 2,396 | 2,263 | +5.9% | 4.04 | 593.1/km2 | ||
| Mahone Bay | 1,064 | 1,036 | +2.7% | 3.12 | 341.0/km2 | ||
| Middleton | 1,873 | 1,832 | +2.2% | 5.55 | 337.5/km2 | ||
| Mulgrave | 627 | 722 | −13.2% | 17.83 | 35.2/km2 | ||
| New Glasgow | 9,471 | 9,075 | +4.4% | 9.96 | 950.9/km2 | ||
| Oxford | 1,170 | 1,190 | −1.7% | 10.68 | 109.6/km2 | ||
| Pictou | 3,107 | 3,186 | −2.5% | 7.99 | 388.9/km2 | ||
| Port Hawkesbury | 3,210 | 3,214 | −0.1% | 8.1 | 396.3/km2 | ||
| Shelburne | 1,644 | 1,743 | −5.7% | 8.75 | 187.9/km2 | ||
| Stellarton | 4,007 | 4,208 | −4.8% | 8.99 | 445.7/km2 | ||
| Stewiacke | 1,557 | 1,373 | +13.4% | 17.62 | 88.4/km2 | ||
| Trenton | 2,407 | 2,474 | −2.7% | 6.07 | 396.5/km2 | ||
| Truro | 12,954 | 12,261 | +5.7% | 37.52 | 345.3/km2 | ||
| Westville | 3,540 | 3,628 | −2.4% | 14.24 | 248.6/km2 | ||
| Wolfville | 5,057 | 4,195 | +20.5% | 6.46 | 782.8/km2 | ||
| Yarmouth | 6,829 | 6,518 | +4.8% | 10.57 | 646.1/km2 | ||
| Total | 96,580 | 93,847 | +2.9% | 242.06 | 399.0/km2 | ||
| Province of Nova Scotia | 969,383 | 923,598 | +5.0% | 52,824.71 | 18.35/km2 | ||
Population centres
The Halifax population centre is the largest urban area in Nova Scotia. Statistics Canada recognizes a total of 37 population centres in the province.
The below table is a list of population centres in Nova Scotia from the 2021 Census of Population.[4]
| Rank | Population centre[4] | Size group[4] | Population (2021)[4] | Population (2016)[4] | Change[4] | Land area[4] | Population density[4] | ||
|---|---|---|---|---|---|---|---|---|---|
| km2 | sq mi | /km2 | /sq mi | ||||||
| 1 | Halifax | Large urban | 348,634 | 317,334 | +9.9% | 238.29 | 92.00 | 1,463.1 | 3,789 |
| 2 | Cape Breton - Sydney | Medium | 30,960 | 30,170 | +2.6% | 30.91 | 11.93 | 1,001.6 | 2,594 |
| 3 | Truro | Small | 23,583 | 23,205 | +1.6% | 31.52 | 12.17 | 748.2 | 1,938 |
| 4 | New Glasgow | Small | 19,316 | 19,137 | +0.9% | 29.82 | 11.51 | 647.8 | 1,678 |
| 5 | Glace Bay | Small | 16,915 | 17,604 | −3.9% | 31.19 | 12.04 | 542.3 | 1,405 |
| 6 | Kentville | Small | 14,905 | 14,449 | +3.2% | 27.98 | 10.80 | 532.7 | 1,380 |
| 7 | Sydney Mines | Small | 12,353 | 12,823 | −3.7% | 18.11 | 6.99 | 682.1 | 1,767 |
| 8 | Amherst | Small | 9,548 | 9,550 | 0.0% | 12.38 | 4.78 | 771.2 | 1,997 |
| 9 | Bridgewater | Small | 8,790 | 8,532 | +3.0% | 13.63 | 5.26 | 644.9 | 1,670 |
| 10 | Yarmouth | Small | 7,848 | 7,527 | +4.3% | 16.81 | 6.49 | 466.9 | 1,209 |
| 11 | Kingston - Greenwood | Small | 7,118 | 6,879 | +3.5% | 17.22 | 6.65 | 413.4 | 1,071 |
| 12 | New Waterford | Small | 6,723 | 7,416 | −9.3% | 9.23 | 3.56 | 728.4 | 1,887 |
| 13 | Enfield - Lantz | Small | 6,583 | 6,807 | −3.3% | 11.67 | 4.51 | 564.1 | 1,461 |
| 14 | Antigonish | Small | 5,620 | 5,079 | +10.7% | 5.88 | 2.27 | 955.8 | 2,476 |
| 15 | Windsor | Small | 5,514 | 5,248 | +5.1% | 10.56 | 4.08 | 522.2 | 1,352 |
| 16 | Wolfville | Small | 5,057 | 4,195 | +20.5% | 6.46 | 2.49 | 782.8 | 2,027 |
| 17 | Still Water Lake | Small | 3,379 | 3,447 | −2.0% | 8.23 | 3.18 | 410.6 | 1,063 |
| 18 | Port Hawkesbury | Small | 2,998 | 3,004 | −0.2% | 5 | 1.9 | 599.6 | 1,553 |
| 19 | Springhill | Small | 2,654 | 2,743 | −3.2% | 4.84 | 1.87 | 548.3 | 1,420 |
| 20 | Pictou | Small | 2,643 | 2,711 | −2.5% | 4.35 | 1.68 | 607.6 | 1,574 |
| 21 | Eskasoni 3 | Small | 2,575 | 2,352 | +9.5% | 5.7 | 2.2 | 451.8 | 1,170 |
| 22 | Liverpool | Small | 2,546 | 2,549 | −0.1% | 3.59 | 1.39 | 709.2 | 1,837 |
| 23 | Berwick | Small | 2,455 | 2,517 | −2.5% | 4.31 | 1.66 | 569.6 | 1,475 |
| 24 | Lunenburg | Small | 2,405 | 2,262 | +6.3% | 3.35 | 1.29 | 717.9 | 1,859 |
| 25 | Lake Echo | Small | 2,365 | 2,515 | −6.0% | 4.76 | 1.84 | 496.8 | 1,287 |
| 26 | Indian Brook 14 | Small | 2,332 | 655 | +256.0% | 3.89 | 1.50 | 599.5 | 1,553 |
| 27 | Digby | Small | 2,001 | 2,060 | −2.9% | 3.16 | 1.22 | 633.2 | 1,640 |
| 28 | Hantsport | Small | 1,542 | 1,560 | −1.2% | 2.89 | 1.12 | 533.6 | 1,382 |
| 29 | Brookside | Small | 1,439 | 1,441 | −0.1% | 2.81 | 1.08 | 512.1 | 1,326 |
| 30 | Shelburne | Small | 1,439 | 1,483 | −3.0% | 2.6 | 1.0 | 553.5 | 1,434 |
| 31 | Middleton | Small | 1,429 | 1,391 | +2.7% | 2.72 | 1.05 | 525.4 | 1,361 |
| 32 | Chester | Small | 1,371 | 1,362 | +0.7% | 3.23 | 1.25 | 424.5 | 1,099 |
| 33 | Inverness | Small | 1,228 | 1,248 | −1.6% | 2.73 | 1.05 | 449.8 | 1,165 |
| 34 | Centreville | Small | 1,159 | 1,129 | +2.7% | 2.36 | 0.91 | 491.1 | 1,272 |
| 35 | Howie Centre | Small | 1,106 | 1,157 | −4.4% | 1.67 | 0.64 | 662.3 | 1,715 |
| 36 | Hayes Subdivision | Small | 1,044 | 1,121 | −6.9% | 1.1 | 0.42 | 949.1 | 2,458 |
| 37 | Port Williams | Small | 1,030 | 1,120 | −8.0% | 1.92 | 0.74 | 536.5 | 1,390 |
Population of Nova Scotia since 1851
|
| ||||||||||||||||||||||||||||||||||||||||||||||||||||||||||||||||||||||||||||||||||||||||||||||||||||||||||||||||||||||
Visible minorities and Indigenous people
| Visible minority and Indigenous population (Canada 2021 Census)[5] | |||
|---|---|---|---|
| Population group | Population | % | |
| European[a] | 809,995 | 84.7% | |
| Visible minority group | South Asian | 21,655 | 2.3% |
| Chinese | 11,600 | 1.2% | |
| Black | 28,220 | 3.0% | |
| Filipino | 6,615 | 0.7% | |
| Arab | 10,610 | 1.1% | |
| Latin American | 2,915 | 0.3% | |
| Southeast Asian | 2,400 | 0.3% | |
| West Asian | 1,875 | 0.2% | |
| Korean | 2,845 | 0.3% | |
| Japanese | 985 | 0.1% | |
| Visible minority, n.i.e. | 970 | 0.1% | |
| Multiple visible minorities | 2,750 | 0.3% | |
| Total visible minority population | 93,430 | 9.8% | |
| Indigenous group | First Nations (North American Indian) | 28,050 | 2.9% |
| Métis | 21,090 | 2.2% | |
| Inuk (Inuit) | 1,100 | 0.1% | |
| Multiple Indigenous responses | 885 | 0.1% | |
| Indigenous responses n.i.e. | 1,300 | 0.1% | |
| Total Indigenous population | 52,430 | 5.5% | |
| Total population | 955,855 | 100.0% | |
Languages
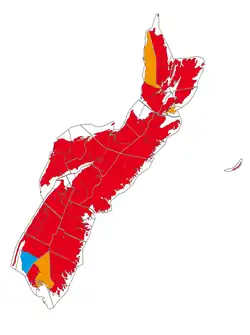
The 2021 Canadian census showed a population of 969,383.
Of the 941,105 singular responses to the census question concerning mother tongue the most commonly reported languages were:[6]
| Ranking | Language | Population | Percentage |
|---|---|---|---|
| 1. | English | 851,545 | 90.48% |
| 2. | French | 27,340 | 2.91% |
| 3. | Arabic | 7,960 | 0.85% |
| 4. | Mandarin | 6,730 | 0.72% |
| 5. | Punjabi | 4,550 | 0.48% |
| 6. | Tagalog | 3,240 | 0.34% |
| 7. | Mi'kmaq | 3,145 | 0.33% |
| 8. | German | 3,050 | 0.32% |
| 9. | Spanish | 2,680 | 0.28% |
| 10. | Korean | 2,340 | 0.25% |
| 11. | Hindi | 2,035 | 0.22% |
| 12. | Malayalam | 1,975 | 0.21% |
| 13. | Russian | 1,735 | 0.18% |
| 14. | Persian | 1,435 | 0.15% |
| 15. | Dutch | 1,395 | 0.15% |
| 16. | Portuguese | 1,305 | 0.14% |
| 17. | Yue (Cantonese) | 1,250 | 0.13% |
| 18. | Gujarati | 1,160 | 0.12% |
| 19. | Urdu | 965 | 0.10% |
| 20. | Vietnamese | 950 | 0.10% |
| 21. | Bengali | 890 | 0.09% |
| 22. | Polish | 870 | 0.09% |
| 23. | Telugu | 750 | 0.08% |
| 24. | Italian | 730 | 0.08% |
| 25. | Greek | 710 | 0.08% |
| 26. | Serbo-Croatian | 580 | 0.06% |
| 27. | Tamil | 555 | 0.06% |
Migration
Immigration
The 2021 Canadian census counted a total of 71,570 immigrants living in Nova Scotia. They are 7.5 percent of the total population of Nova Scotia.[7]
The most commonly reported origins for these immigrants were:
| Country of Birth | 2021[8][7] | 2016[9] | 2011[10][11] | 2006[12][13] | 2001[14][15] | |||||
|---|---|---|---|---|---|---|---|---|---|---|
| Pop. | % | Pop. | % | Pop. | % | Pop. | % | Pop. | % | |
| United Kingdom | 11,930 | 16.7% | 11,270 | 20.2% | 11,000 | 22.8% | 11,660 | 25.8% | 10,800 | 26.1% |
| United States | 7,570 | 10.6% | 7,375 | 13.2% | 8,275 | 17.1% | 7,960 | 17.6% | 8,065 | 19.5% |
| India | 5,605 | 7.8% | 2,225 | 4% | 1,415 | 2.9% | 1,440 | 3.2% | 1,140 | 2.8% |
| Philippines | 4,755 | 6.6% | 2,575 | 4.6% | 1,325 | 2.7% | 420 | 0.9% | 495 | 1.2% |
| China | 4,320 | 6% | 2,830 | 5.1% | 1,710 | 3.5% | 1,740 | 3.9% | 1,025 | 2.5% |
| Syria | 2,420 | 3.4% | 1,150 | 2.1% | 185 | 0.4% | 135 | 0.3% | 180 | 0.4% |
| Germany | 2,375 | 3.3% | 2,600 | 4.7% | 2,385 | 4.9% | 2,850 | 6.3% | 2,455 | 5.9% |
| Nigeria | 1,745 | 2.4% | 350 | 0.6% | 215 | 0.4% | 165 | 0.4% | 105 | 0.3% |
| Lebanon | 1,565 | 2.2% | 1,365 | 2.5% | 1,590 | 3.3% | 1,265 | 2.8% | 1,460 | 3.5% |
| Netherlands | 1,465 | 2% | 1,645 | 3% | 1,530 | 3.2% | 1,830 | 4% | 1,975 | 4.8% |
| Total immigrants | 71,570 | 7.5% | 55,680 | 6.1% | 48,275 | 5.3% | 45,190 | 5% | 41,315 | 4.6% |
| Total responses | 955,855 | 98.6% | 908,340 | 98.3% | 906,175 | 98.3% | 903,090 | 98.9% | 897,570 | 98.9% |
| Total population | 969,383 | 100% | 923,598 | 100% | 921,727 | 100% | 913,462 | 100% | 908,007 | 100% |
Internal migration

A total of 101,035 people moved to Nova Scotia from other parts of Canada between 1996 and 2006 while 110,335 people moved in the opposite direction. These movements resulted in a net outmigration of 11,925 people to Alberta and 4,120 to Ontario; as well as a net influx of 4,690 people from Newfoundland and Labrador and 2,930 from New Brunswick. During this period there was a net outmigration of 835 francophones to Quebec and 340 to Alberta; and a net influx of 575 anglophones from Quebec and 145 francophones from New Brunswick. (All net inter-provincial movements of more than 500 persons and official minority movements of more than 100 persons are given.)[16][17]
Religion
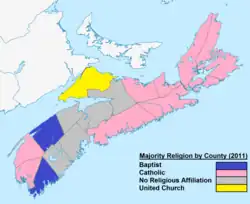
| Religious group | 2021[18] | 2011[19] | 2001[20] | 1991[21] | 1981[22] | |||||
|---|---|---|---|---|---|---|---|---|---|---|
| Pop. | % | Pop. | % | Pop. | % | Pop. | % | Pop. | % | |
Christianity  |
556,115 | 58.18% | 690,460 | 76.19% | 780,530 | 86.96% | 815,815 | 91.57% | 800,325 | 95.3% |
| No religion | 359,395 | 37.6% | 197,665 | 21.81% | 106,405 | 11.85% | 68,010 | 7.63% | 34,335 | 4.09% |
Islam  |
14,715 | 1.54% | 8,505 | 0.94% | 3,545 | 0.39% | 1,435 | 0.16% | 790 | 0.09% |
Hinduism  |
8,460 | 0.89% | 1,850 | 0.2% | 1,235 | 0.14% | 970 | 0.11% | 1,025 | 0.12% |
Sikhism  |
4,735 | 0.5% | 390 | 0.04% | 270 | 0.03% | 330 | 0.04% | 275 | 0.03% |
Buddhism  |
2,955 | 0.31% | 2,205 | 0.24% | 1,735 | 0.19% | 1,485 | 0.17% | 420 | 0.05% |
Judaism  |
2,195 | 0.23% | 1,805 | 0.2% | 2,120 | 0.24% | 1,950 | 0.22% | 2,010 | 0.24% |
| Indigenous spirituality | 1,090 | 0.11% | 570 | 0.06% | N/a | N/a | N/a | N/a | N/a | N/a |
| Other | 6,195 | 0.65% | 2,720 | 0.3% | 1,720 | 0.19% | 960 | 0.11% | 525 | 0.06% |
| Total responses | 955,855 | 98.6% | 906,175 | 98.31% | 897,570 | 98.85% | 890,950 | 99% | 839,800 | 99.1% |
| Total population | 969,383 | 100% | 921,727 | 100% | 908,007 | 100% | 899,942 | 100% | 847,442 | 100% |
Employment
As of February 2019, the unemployment rate for the province is 6.4 percent. Halifax Regional Municipality 4.9 percent [23]
Income
| By County | By Community | |||||||||||||||||||||||||||||||||||||||||||||||||||||||||||||||||||||||||||||||||||||||||||||||||||||||||||||||||||||||||||||||||||||||||||||||||||||||||||||||||||||
|---|---|---|---|---|---|---|---|---|---|---|---|---|---|---|---|---|---|---|---|---|---|---|---|---|---|---|---|---|---|---|---|---|---|---|---|---|---|---|---|---|---|---|---|---|---|---|---|---|---|---|---|---|---|---|---|---|---|---|---|---|---|---|---|---|---|---|---|---|---|---|---|---|---|---|---|---|---|---|---|---|---|---|---|---|---|---|---|---|---|---|---|---|---|---|---|---|---|---|---|---|---|---|---|---|---|---|---|---|---|---|---|---|---|---|---|---|---|---|---|---|---|---|---|---|---|---|---|---|---|---|---|---|---|---|---|---|---|---|---|---|---|---|---|---|---|---|---|---|---|---|---|---|---|---|---|---|---|---|---|---|---|---|---|---|---|---|
|
|
Notes
References
- ↑ "Nova Scotia Quarterly Population Estimates as of April 1, 2024, Nova Scotia Finance and Treasury Board". Government of Nova Scotia. 1 April 2024. Retrieved 6 March 2025.
- ↑ "Population estimates, quarterly". Statistics Canada. March 19, 2025. Retrieved March 19, 2025.
- 1 2 3 4 5 6 "Population and dwelling counts: Canada, provinces and territories, and census subdivisions (municipalities), 2021 and 2016 censuses (Nova Scotia)". Statistics Canada. July 8, 2023. Retrieved July 8, 2023. Cite error: Invalid
<ref>tag; name "2021StatCanNS" defined multiple times with different content. - 1 2 3 4 5 6 7 8 "Population and dwelling counts: Canada and population centres". Statistics Canada. February 9, 2022. Retrieved February 11, 2022.
- ↑ Government of Canada, Statistics Canada (2022-10-26). "Census Profile, 2021 Census of Population". www12.statcan.gc.ca. Retrieved 2023-07-04.
- ↑ "Profile table, Census Profile, 2021 Census of Population - Nova Scotia [Province]". www12.statcan.gc.ca. Statistics Canada. Retrieved 18 April 2025.
- 1 2 Government of Canada, Statistics Canada (2022-10-26). "Census Profile, 2021 Census of Population". www12.statcan.gc.ca. Retrieved 2022-12-04.
- ↑ Government of Canada, Statistics Canada (2023-06-21). "Place of birth and period of immigration by gender and age: Province or territory". www12.statcan.gc.ca. Retrieved 2023-10-15.
- ↑ Government of Canada, Statistics Canada (2019-06-17). "Data tables, 2016 Census Immigrant Status and Period of Immigration (11), Place of Birth (272), Age (7A) and Sex (3) for the Population in Private Households of Canada, Provinces and Territories, Census Divisions and Census Subdivisions, 2016 Census - 25% Sample Data". www12.statcan.gc.ca. Retrieved 2023-03-04.
- ↑ Government of Canada, Statistics Canada (2019-01-23). "2011 National Household Survey: Data tables Profile - Immigration and Ethnocultural Diversity, and Aboriginal Peoples for Canada, Provinces, Territories, Census Divisions and Census Subdivisions, National Household Survey, 2011". www12.statcan.gc.ca. Retrieved 2023-03-04.
- ↑ Government of Canada, Statistics Canada (2019-01-23). "2011 National Household Survey: Data tables Citizenship (5), Place of Birth (236), Immigrant Status and Period of Immigration (11), Age Groups (10) and Sex (3) for the Population in Private Households of Canada, Provinces, Territories, Census Metropolitan Areas and Census Agglomerations, 2011 National Household Survey". www12.statcan.gc.ca. Retrieved 2023-11-11.
- ↑ Government of Canada, Statistics Canada (2009-03-23). "Place of birth for the immigrant population by period of immigration, 2006 counts and percentage distribution, for Canada, provinces and territories - 20% sample data". www12.statcan.gc.ca. Retrieved 2023-03-04.
- ↑ Government of Canada, Statistics Canada (2020-05-01). "2006 Census Topic-based tabulations Immigrant Status and Period of Immigration (8) and Place of Birth (261) for the Immigrants and Non-permanent Residents of Canada, Provinces, Territories, Census Metropolitan Areas and Census Agglomerations, 2006 Census - 20% Sample Data". www12.statcan.gc.ca. Retrieved 2023-03-04.
- ↑ Government of Canada, Statistics Canada (2013-12-23). "2001 Census Topic-based tabulations Immigrant Status and Period of Immigration (10A) and Place of Birth of Respondent (260) for Immigrants and Non-permanent Residents, for Canada, Provinces, Territories, Census Metropolitan Areas and Census Agglomerations, 2001 Census - 20% Sample Data". www12.statcan.gc.ca. Retrieved 2023-03-04.
- ↑ Government of Canada, Statistics Canada (2013-12-23). "2001 Census Topic-based tabulations Selected Places of Birth (85) for the Immigrant Population, for Canada, Provinces, Territories, Census Metropolitan Areas and Census Agglomerations, 1996 and 2001 Censuses - 20% Sample Data". www12.statcan.gc.ca. Retrieved 2023-03-04.
- ↑ Province or Territory of Residence 5 Years Ago (14), Mother Tongue (8), Age Groups (16) and Sex (3) (2006 Census) Archived February 11, 2009, at the Wayback Machine
- ↑ "2001 Census". www12.statcan.ca. Archived from the original on 2009-02-11.
- ↑ Government of Canada, Statistics Canada (2022-10-26). "Census Profile, 2021 Census of Population". www12.statcan.gc.ca. Retrieved 2023-04-22.
- ↑ Government of Canada, Statistics Canada (2015-11-27). "NHS Profile". www12.statcan.gc.ca. Retrieved 2023-04-22.
- ↑ Government of Canada, Statistics Canada (2019-07-02). "2001 Community Profiles". www12.statcan.gc.ca. Retrieved 2023-04-22.
- ↑ Government of Canada, Statistics Canada (2019-03-29). "Data tables, 1991 Census R9101 - Population by Religion (29), Showing Age Groups (13) Education (20% Data) - Canada, provinces and territories, census divisions and census subdivisions". www12.statcan.gc.ca. Retrieved 2023-04-22.
- ↑ Government of Canada, Statistics Canada (2013-04-03). "1981 Census of Canada 20 per cent data base : highlight information on ethnicity, place of birth, citizenship, income, language, immigration, religion, shelter costs". www12.statcan.gc.ca. Retrieved 2023-04-22.
- ↑ Government of Canada, Statistics Canada (2022-03-11). "Labour force characteristics by province, monthly, seasonally adjusted". www150.statcan.gc.ca. Retrieved 2022-03-23.
- 1 2 National Household Survey (NHS) Profile - Select from a List Archived 2014-05-12 at the Wayback Machine Statistics Canada
| Historical counties |
|
|---|---|
| Economic regions |
|
| Regional municipalities |
|
| County municipalities |
|
| District municipalities |
|
| Towns | |
| Villages | |
| Lists | |
| |

| Ethnic ancestry |
| ||||||||||||||||||||||||||||||||||||||||
|---|---|---|---|---|---|---|---|---|---|---|---|---|---|---|---|---|---|---|---|---|---|---|---|---|---|---|---|---|---|---|---|---|---|---|---|---|---|---|---|---|---|
| Demographics |
| ||||||||||||||||||||||||||||||||||||||||
| Culture & society |
| ||||||||||||||||||||||||||||||||||||||||
| List of Canadians |
| ||||||||||||||||||||||||||||||||||||||||
| |||||||||||||||||||||||||||||||||||||||||
