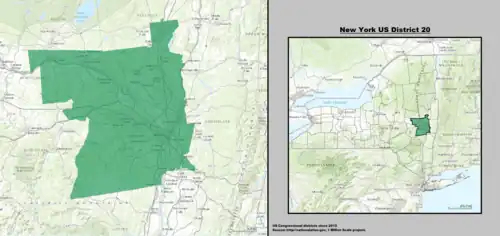
Election history
| 1996 United States House of Representatives elections in New York's 20th district |
| Party |
Candidate |
Votes |
% |
±% |
|
Republican |
Benjamin A. Gilman |
122,479 |
57.1% |
|
|
Democratic |
Yash A. Aggarwal |
80,761 |
37.6% |
|
|
Right to Life |
Robert F. Garrison |
6,356 |
3.0% |
|
|
Independence |
Ira W. Goodman |
5,016 |
2.3% |
|
| Majority |
41,718 |
19.4% |
|
| Turnout |
214,612 |
100% |
|
| 1998 United States House of Representatives elections in New York's 20th district |
| Party |
Candidate |
Votes |
% |
±% |
|
Republican |
Benjamin A. Gilman |
98,546 |
58.3% |
+1.2% |
|
Democratic |
Paul J. Feiner |
65,589 |
38.8% |
+1.2% |
|
Right to Life |
Christine M. Tighe |
4,769 |
2.8% |
-0.2% |
| Majority |
32,957 |
19.5% |
+0.1% |
| Turnout |
168,904 |
100% |
-21.3% |
| 2000 United States House of Representatives elections in New York's 20th district |
| Party |
Candidate |
Votes |
% |
±% |
|
Republican |
Benjamin A. Gilman |
136,016 |
57.6% |
-0.7% |
|
Democratic |
Paul J. Feiner |
94,646 |
40.1% |
+1.3% |
|
Right to Life |
Christine M. Tighe |
5,371 |
2.3% |
-0.5% |
| Majority |
41,370 |
17.5% |
-2.0% |
| Turnout |
236,033 |
100% |
+39.7% |
| 2002 United States House of Representatives elections in New York's 20th district |
| Party |
Candidate |
Votes |
% |
±% |
|
Republican |
John E. Sweeney |
140,238 |
73.3% |
+15.7% |
|
Democratic |
Frank Stoppenbach |
45,878 |
24.0% |
-16.1% |
|
Green |
Margaret Lewis |
5,162 |
2.7% |
+2.7% |
| Majority |
94,360 |
49.3% |
+31.8% |
| Turnout |
191,278 |
100% |
-19.0% |
| 2004 United States House of Representatives elections in New York's 20th district |
| Party |
Candidate |
Votes |
% |
±% |
|
Republican |
John E. Sweeney |
188,753 |
65.8% |
-7.5% |
|
Democratic |
Doris F. Kelly |
96,630 |
33.7% |
+9.7% |
|
Centrist Party |
Morris N. Guller |
1,353 |
0.5% |
+0.5% |
| Majority |
92,123 |
32.1% |
-17.2% |
| Turnout |
286,736 |
100% |
+49.9% |
| 2006 United States House of Representatives elections in New York's 20th district |
| Party |
Candidate |
Votes |
% |
±% |
|
Democratic |
Kirsten Gillibrand |
125,168 |
53.1% |
+19.4% |
|
Republican |
John E. Sweeney |
110,554 |
46.9% |
-18.9% |
| Majority |
14,614 |
6.2% |
-25.9% |
| Turnout |
235,722 |
100% |
-17.8% |
| 2008 United States House of Representatives elections in New York's 20th district[3] |
| Party |
Candidate |
Votes |
% |
±% |
|
Democratic |
Kirsten Gillibrand |
177,677 |
61.8% |
+8.7% |
|
Republican |
Sandy Treadwell |
109,644 |
38.2% |
-8.7% |
| Majority |
68,033 |
23.6% |
+17.4% |
| Turnout |
287,321 |
100% |
+21.9% |
| 2009 New York's 20th congressional district special election[4] |
| Party |
Candidate |
Votes |
% |
±% |
|
Democratic |
Scott Murphy |
80,833 |
50.23% |
-11.57% |
|
Republican |
James Tedisco |
80,107 |
49.77% |
+11.57% |
| Majority |
726 |
0.45% |
-23.15% |
| Turnout |
160,940 |
100% |
-44.0% |
| 2010 United States House of Representatives elections in New York's 20th district[5] |
| Party |
Candidate |
Votes |
% |
±% |
|
Republican |
Chris Gibson |
130,176 |
54.87% |
+5.10% |
|
Democratic |
Scott Murphy |
107,077 |
45.13% |
-5.10% |
| Majority |
23,099 |
9.74% |
+9.29% |
| Turnout |
237,253 |
100% |
+47.4% |
| 2012 United States House of Representatives elections in New York's 20th district[6] |
| Party |
Candidate |
Votes |
% |
±% |
|
Democratic |
Paul Tonko |
203,401 |
68.44% |
+23.3% |
|
Republican |
Robert J. Dieterich |
93,778 |
31.56% |
-23.3% |
| Majority |
109,623 |
36.89% |
+27.2% |
| Turnout |
313,024 |
100% |
+31.93% |
| 2014 United States House of Representatives elections in New York's 20th district[7] |
| Party |
Candidate |
Votes |
% |
±% |
|
Democratic |
Paul Tonko |
125,111 |
61.26% |
-7.18% |
|
Republican |
James M. Fischer |
79,104 |
38.74% |
+7.18% |
| Majority |
46007 |
22.53% |
-14.36% |
| Turnout |
171,118 |
100% |
-45.33% |
| 2016 United States House of Representatives elections in New York's 20th district[8] |
| Party |
Candidate |
Votes |
% |
±% |
|
Democratic |
Paul Tonko |
213,018 |
67.89% |
+6.63% |
|
Republican |
Joe Vitollo |
100,740 |
32.11% |
-6.63% |
| Majority |
112,278 |
35.78% |
+13.25% |
| Turnout |
325,296 |
100% |
+90.10% |
| 2018 United States House of Representatives elections in New York's 20th district[9] |
| Party |
Candidate |
Votes |
% |
±% |
|
Democratic |
Paul Tonko |
176,811 |
66.50% |
-1.39% |
|
Republican |
Joe Vitollo |
89,058 |
33.50% |
+1.39% |
| Majority |
87,753 |
33.01% |
-2.77% |
| Turnout |
264,564 |
100% |
-18.67% |
References
- ↑ Center for New Media & Promotion (CNMP), US Census Bureau. "My Congressional District". www.census.gov.
- ↑ "Partisan Voting Index – Districts of the 115th Congress" (PDF). The Cook Political Report. April 7, 2017. Archived (PDF) from the original on June 7, 2017. Retrieved April 7, 2017.
- ↑ Neuman, William (November 5, 2008). "Election Results 2008: New York". New York Times. Archived from the original on December 17, 2008. Retrieved December 6, 2008.
- ↑ "Statement of Canvass: 20th Congressional District" (PDF). New York State Board of Elections. May 2009. Archived (PDF) from the original on November 5, 2013. Retrieved May 15, 2009.
- ↑ "Archived copy" (PDF). Archived (PDF) from the original on August 23, 2012. Retrieved July 24, 2012.
{{cite web}}: CS1 maint: archived copy as title (link) 2010 election results
- ↑ "NYS Board of Elections Rep. in Congress Election Returns Nov. 6, 2012" (PDF). Archived from the original (PDF) on December 22, 2020. Retrieved June 4, 2020. 2012 election results
- ↑ "NYS Board of Elections Rep. in Congress Election Returns November 4, 2014" (PDF). Archived from the original (PDF) on May 4, 2020. Retrieved June 4, 2020. 2014 election results
- ↑ "NYS Board of Elections Rep. in Congress Election Returns Nov. 8, 2016" (PDF). Archived from the original (PDF) on May 19, 2017. Retrieved June 4, 2020. 2016 election results
- ↑ "Certified Results from the November 6, 2018 General Election for U.S. Congress" (PDF). Archived from the original (PDF) on January 4, 2019. Retrieved June 4, 2020. 2018 election results