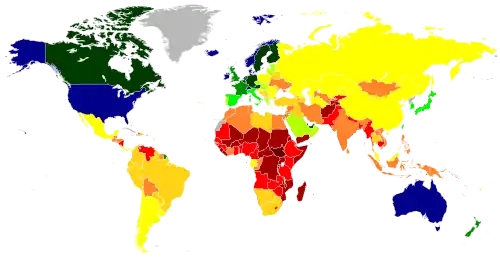
List of countries by GDP (nominal) per capita
|
>$60,000
$50,000 - $60,000
$40,000 - $50,000
$30,000 - $40,000 |
$20,000 - $30,000
$10,000 - $20,000
$5,000 - $10,000
$2,500 - $5,000 |
$1,000 - $2,500
$500 - $1,000
<$500
No Data |
The figures presented here do not take into account differences in the cost of living in different countries, and the results vary greatly from one year to another based on fluctuations in the exchange rates of the country's currency. Such fluctuations change a country's ranking from one year to the next, even though they often make little or no difference to the standard of living of its population.
Therefore, these figures should be used with caution. GDP per capita is often considered an indicator of a country's standard of living;[1][2] however, this is problematic because GDP per capita is not a measure of personal income.
Comparisons of national income are also frequently made on the basis of purchasing power parity (PPP), to adjust for differences in the cost of living in different countries. (See List of countries by GDP (PPP) per capita.) PPP largely removes the exchange rate problem but not others; it does not reflect the value of economic output in international trade, and it also requires more estimation than GDP per capita. On the whole, PPP per capita figures are more narrowly spread than nominal GDP per capita figures.
Non-sovereign entities (the world, continents, and some dependent territories) and states with limited international recognition (such as Kosovo, Palestine and Taiwan) are included in the list in cases in which they appear in the sources. These economies are not ranked in the charts here, but are listed in sequence by GDP for comparison. In addition, non-sovereign entities are marked in italics.
Note that many of leading GDP-per-capita (nominal) jurisdictions, such as Ireland, are tax haven's. Their GDP data are subject to material distortion by the tax planning activities of foreign multinationals. To address this, in 2017 the Central Bank of Ireland created "Modified gross national income|modified GNI" (or GNI*) as a more appropriate statistic, and the OECD and IMF have adopted it for Ireland.
All data are in current United States dollars.
Table
The table initially ranks each country or territory with their latest available estimates, and can be reranked by either of the sources
* Nearly all country links in the table take to articles titled "Income in country or territory" or to "Economy of country or territory".
| Country/Territory | UN Region | IMF[3][4] | United Nations[5] | World Bank[6] | |||
|---|---|---|---|---|---|---|---|
| Estimate | Year | Estimate | Year | Estimate | Year | ||
 Liechtenstein | Europe | N/a | 180,227 | 2020 | 169,049 | 2019 | |
 Monaco | Europe | N/a | 173,696 | 2020 | 173,688 | 2020 | |
 Luxembourg | Europe | 135,046 | 2022 | 117,182 | 2020 | 135,683 | 2021 |
 Bermuda | Americas | N/a | 123,945 | 2020 | 110,870 | 2021 | |
 Ireland | Europe | 101,509 | 2022 | 86,251 | 2020 | 85,268 | 2020 |
 Norway | Europe | 99,481 | 2022 | 66,871 | 2020 | 67,390 | 2020 |
 CaymanIslands | Americas | N/a | 95,191 | 2020 | 85,083 | 2020 | |
 Switzerland | Europe | 96,390 | 2022 | 86,919 | 2020 | 87,097 | 2020 |
 Qatar | Asia | 84,514 | 2022 | 50,815 | 2020 | 50,124 | 2020 |
 Singapore | Asia | 79,576 | 2022 | 58,114 | 2020 | 59,798 | 2020 |
 United States * | Americas | 76,027 | 2022 | 63,123 | 2020 | 63,414 | 2020 |
 Iceland | Europe | 74,417 | 2022 | 63,644 | 2020 | 59,270 | 2020 |
 Denmark | Europe | 68,094 | 2022 | 61,477 | 2020 | 61,063 | 2020 |
 Australia | Oceania | 67,464 | 2022 | 55,823 | 2020 | 51,693 | 2020 |
 Sweden | Europe | 57,978 | 2022 | 53,575 | 2020 | 52,274 | 2020 |
 Netherlands | Europe | 57,836 | 2022 | 53,334 | 2020 | 52,397 | 2020 |
 Canada | Americas | 57,406 | 2022 | 43,560 | 2020 | 43,258 | 2020 |
 Greenland | Americas | N/a | 55,139 | 2020 | 53,041 | 2019 | |
 Israel | Asia | 54,688 | 2022 | 47,034 | 2020 | 44,169 | 2020 |
 Finland | Europe | 53,745 | 2022 | 48,685 | 2020 | 48,773 | 2020 |
 Austria | Europe | 53,371 | 2022 | 48,106 | 2020 | 48,587 | 2020 |
 Belgium | Europe | 52,485 | 2022 | 45,028 | 2020 | 45,159 | 2020 |
 Germany | Europe | 51,104 | 2022 | 45,909 | 2020 | 46,208 | 2020 |
 Macau * | Asia | 50,578 | 2022 | 37,474 | 2020 | 39,403 | 2020 |
 UnitedArab Emirates | Asia | 50,349 | 2022 | 36,285 | 2020 | 36,285 | 2020 |
 San Marino | Europe | 49,901 | 2022 | 45,832 | 2020 | 47,731 | 2019 |
 Hong Kong | Asia | 49,850 | 2022 | 46,611 | 2020 | 46,324 | 2020 |
 New Zealand | Oceania | 49,847 | 2022 | 43,972 | 2020 | 41,442 | 2020 |
 United Kingdom | Europe | 49,761 | 2022 | 40,718 | 2020 | 41,125 | 2020 |
 BritishVirgin Islands | Americas | N/a | 49,357 | 2020 | N/a | ||
 France * | Europe | 44,747 | 2022 | 38,959 | 2020 | 39,030 | 2020 |
 Andorra | Europe | 41,930 | 2022 | 37,072 | 2020 | 40,897 | 2019 |
 Japan | Asia | 39,243 | 2022 | 39,990 | 2020 | 40,193 | 2020 |
 Kuwait | Asia | 38,755 | 2022 | 24,809 | 2020 | 24,812 | 2020 |
 Puerto Rico | Americas | 37,823 | 2022 | 36,052 | 2020 | 32,291 | 2020 |
 Taiwan | Asia | 36,051 | 2022 | 28,383 | [7][8]2020 | N/a | |
 South Korea | Asia | 34,994 | 2022 | 31,947 | 2020 | 31,632 | 2020 |
 Italy | Europe | 34,777 | 2022 | 31,238 | 2020 | 31,714 | 2020 |
 Guam | Oceania | N/a | N/a | 34,624 | 2020 | ||
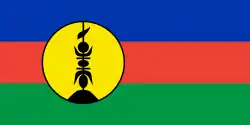 New Caledonia | Oceania | N/a | 34,006 | 2020 | 34,789 | 2019 | |
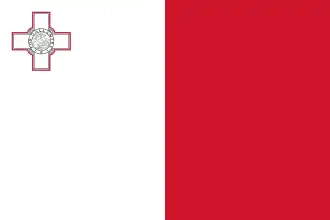 Malta | Europe | 33,094 | 2022 | 33,771 | 2020 | 27,885 | 2020 |
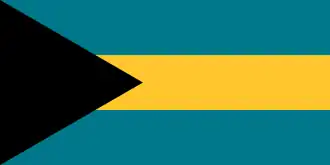 Bahamas | Americas | 32,077 | 2022 | 25,194 | 2020 | 25,194 | 2020 |
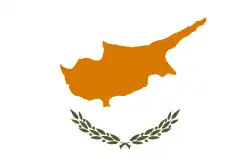 Cyprus * | Europe | 30,663 | 2022 | 28,133 | 2020 | 26,624 | 2020 |
 Slovenia | Europe | 30,159 | 2022 | 25,777 | 2020 | 25,517 | 2020 |
 Spain | Europe | 30,157 | 2022 | 27,409 | 2020 | 27,063 | 2020 |
 Bahrain | Asia | 29,103 | 2022 | 19,925 | 2020 | 20,410 | 2020 |
 Aruba | Americas | 28,863 | 2022 | 23,386 | 2020 | 30,253 | 2018 |
 Saudi Arabia | Asia | 28,759 | 2022 | 20,110 | 2020 | 20,110 | 2020 |
 Estonia | Europe | 27,971 | 2022 | 23,106 | 2020 | 23,027 | 2020 |
 Czech Republic | Europe | 27,609 | 2022 | 22,911 | 2020 | 22,932 | 2020 |
 Lithuania | Europe | 25,015 | 2022 | 20,772 | 2020 | 20,234 | 2020 |
 Portugal | Europe | 24,495 | 2022 | 22,413 | 2020 | 22,176 | 2020 |
 Turks andCaicos Islands | Americas | N/a | 23,881 | 2020 | 23,880 | 2020 | |
 Oman | Asia | 23,416 | 2022 | 12,409 | 2020 | 12,660 | 2020 |
 Slovakia | Europe | 21,665 | 2022 | 19,264 | 2020 | 19,267 | 2020 |
 Latvia | Europe | 21,311 | 2022 | 17,871 | 2020 | 17,726 | 2020 |
 Greece | Europe | 20,940 | 2022 | 18,117 | 2020 | 17,623 | 2020 |
 FrenchPolynesia | Oceania | N/a | 20,707 | 2020 | 14,324 | 2000 | |
 NorthernMariana Islands | Oceania | N/a | N/a | 20,660 | 2019 | ||
 Hungary | Europe | 20,336 | 2022 | 16,129 | 2020 | 15,981 | 2020 |
 Iran | Asia | 20,261 | 2022 | 11,183 | 2020 | 2,423 | 2020 |
 Sint Maarten | Americas | N/a | 20,000 | 2020 | 29,160 | 2018 | |
 Saint Kittsand Nevis | Americas | 19,117 | 2022 | 17,434 | 2020 | 18,438 | 2020 |
 Barbados | Americas | 19,110 | 2022 | 15,449 | 2020 | 15,374 | 2020 |
 Poland | Europe | 18,506 | 2022 | 15,764 | 2020 | 15,721 | 2020 |
 Uruguay | Americas | 18,083 | 2022 | 15,438 | 2020 | 15,438 | 2020 |
 Trinidadand Tobago | Americas | 17,921 | 2022 | 15,286 | 2020 | 15,426 | 2020 |
 Seychelles | Africa | 17,693 | 2022 | 10,767 | 2020 | 10,764 | 2020 |
 Croatia | Europe | 17,338 | 2022 | 13,934 | 2020 | 14,134 | 2020 |
 Anguilla | Americas | N/a | 17,226 | 2020 | N/a | ||
 Guyana | Americas | 17,108 | 2022 | 6,956 | 2020 | 6,956 | 2020 |
 Curaçao | Americas | N/a | 15,819 | 2020 | 16,746 | 2020 | |
 Cook Islands | Oceania | N/a | 16,135 | 2020 | N/a | ||
 Antiguaand Barbuda | Americas | 16,085 | 2022 | 13,993 | 2020 | 13,993 | 2020 |
 Panama | Americas | 16,038 | 2022 | 12,269 | 2020 | 12,510 | 2020 |
 Chile | Americas | 15,941 | 2022 | 13,232 | 2020 | 13,232 | 2020 |
 Romania | Europe | 14,825 | 2022 | 12,929 | 2020 | 12,896 | 2020 |
 China * | Asia | 14,096 | [n 1]2022 | 10,229 | [n 1]2020 | 10,435 | 2020 |
 Maldives | Asia | 14,078 | 2022 | 6,924 | 2020 | 6,924 | 2020 |
 Palau | Oceania | 13,706 | 2022 | 14,567 | 2020 | 14,244 | 2020 |
 Montserrat | Americas | N/a | 13,523 | 2020 | N/a | ||
 Malaysia | Asia | 13,268 | 2022 | 10,402 | 2020 | 10,412 | 2020 |
 Bulgaria | Europe | 13,101 | 2022 | 10,058 | 2020 | 10,079 | 2020 |
 AmericanSamoa | Oceania | N/a | N/a | 12,845 | 2020 | ||
 Russia | Europe | 12,575 | 2022 | 10,166 | 2020 | 10,127 | 2020 |
 Costa Rica | Americas | 12,483 | 2022 | 12,077 | 2020 | 12,141 | 2020 |
 Turkmenistan | Asia | 12,274 | 2022 | 7,104 | 2020 | 7,612 | 2019 |
 Argentina | Americas | 12,187 | 2022 | 8,476 | 2020 | 8,579 | 2020 |
 Saint Lucia | Americas | 11,364 | 2022 | 8,805 | 2020 | 8,805 | 2020 |
| World | N/a | 10,949 | 2020 | 10,926 | 2020 | ||
 Equatorial Guinea | Africa | 10,902 | 2022 | 7,143 | 2020 | 7,143 | 2020 |
 Grenada | Americas | 10,472 | 2022 | 9,273 | 2020 | 9,262 | 2020 |
 Gabon | Africa | 10,390 | 2022 | 6,789 | 2020 | 7,006 | 2020 |
 DominicanRepublic | Americas | 10,259 | 2022 | 7,268 | 2020 | 7,268 | 2020 |
 Mexico | Americas | 10,166 | 2022 | 8,326 | 2020 | 8,329 | 2020 |
 Nauru | Oceania | 10,005 | 2022 | 12,510 | 2020 | 10,580 | 2020 |
 Kazakhstan | Asia | 10,003 | 2022 | 9,111 | 2020 | 9,122 | 2020 |
 Montenegro | Europe | 9,673 | 2022 | 7,626 | 2020 | 7,677 | 2020 |
 Serbia | Europe | 9,503 | 2022 | 7,656 | 2020 | 7,721 | 2020 |
 Cuba | Americas | 1,981 | 2022 | 3,000 | 2020 | 3,000 | 2020 |
 Mauritius | Africa | 8,892 | 2022 | 8,587 | 2020 | 8,628 | 2020 |
 Saint Vincent andthe Grenadines | Americas | 8,595 | 2022 | 7,298 | 2020 | 7,298 | 2020 |
 Dominica | Americas | 8,575 | 2022 | 7,038 | 2020 | 7,268 | 2020 |
 Brazil | Americas | 8,570 | 2022 | 6,797 | 2020 | 6,797 | 2020 |
 Turkey | Asia | 8,081 | 2022 | 8,538 | 2020 | 8,536 | 2020 |
 Botswana * | Africa | 7,519 | 2022 | 6,711 | 2020 | 6,711 | 2020 |
 Thailand | Asia | 7,449 | 2022 | 7,189 | 2020 | 7,189 | 2020 |
 Libya | Africa | 7,197 | 2022 | 4,243 | 2020 | 3,699 | 2020 |
 Azerbaijan * | Asia | 7,165 | 2022 | 4,202 | 2020 | 4,214 | 2020 |
 Bosnia andHerzegovina | Europe | 7,078 | 2022 | 6,035 | 2020 | 6,032 | 2020 |
 Iraq | Asia | 7,038 | 2022 | 4,146 | 2020 | 4,158 | 2020 |
 Peru | Americas | 7,034 | 2022 | 6,163 | 2020 | 6,127 | 2020 |
 South Africa * | Africa | 6,979 | 2022 | 5,094 | 2020 | 5,091 | 2020 |
 NorthMacedonia | Europe | 6,863 | 2022 | 5,886 | 2020 | 5,888 | 2020 |
 Colombia | Americas | 6,807 | 2022 | 5,333 | 2020 | 5,333 | 2020 |
 Ecuador | Americas | 6,412 | 2022 | 5,600 | 2020 | 5,600 | 2020 |
 Belarus | Europe | 6,384 | 2022 | 6,377 | 2020 | 6,411 | 2020 |
 Albania | Europe | 6,260 | 2022 | 5,181 | 2020 | 5,215 | 2020 |
 Tuvalu | Oceania | 6,047 | 2022 | 4,648 | 2020 | 4,143 | 2020 |
 Jamaica | Americas | 5,730 | 2022 | 4,665 | 2020 | 4,665 | 2020 |
 Fiji | Oceania | 5,685 | 2022 | 5,013 | 2020 | 4,882 | 2020 |
 Paraguay | Americas | 5,626 | 2022 | 4,950 | 2020 | 4,950 | 2020 |
 Georgia | Asia | 5,618 | 2022 | 3,984 | 2020 | 4,279 | 2020 |
 Moldova | Europe | 5,435 | 2022 | 2,954 | 2020 | 4,551 | 2020 |
 Kosovo | Europe | 5,355 | 2022 | 4,368 | 2020 | 4,287 | 2020 |
 Tonga | Oceania | 5,283 | 2022 | 4,646 | 2020 | 4,903 | 2019 |
 Mongolia | Asia | 5,206 | 2022 | 4,007 | 2020 | 4,007 | 2020 |
 Namibia | Africa | 5,016 | 2022 | 4,215 | 2020 | 4,211 | 2020 |
 Guatemala | Americas | 4,864 | 2022 | 4,332 | 2020 | 4,603 | 2020 |
 Suriname | Americas | 4,843 | 2022 | 7,023 | 2020 | 6,491 | 2020 |
 Ukraine | Europe | 4,828 | 2021 | 3,557 | 2020 | 3,727 | 2020 |
 MarshallIslands | Oceania | 4,756 | 2022 | 4,130 | 2020 | 4,073 | 2019 |
 Armenia | Asia | 4,741 | 2022 | 4,266 | 2020 | 4,268 | 2020 |
 Indonesia | Asia | 4,691 | 2022 | 3,870 | 2020 | 3,870 | 2020 |
 El Salvador | Americas | 4,689 | 2022 | 3,799 | 2020 | 3,799 | 2020 |
 Jordan | Asia | 4,635 | 2022 | 4,283 | 2020 | 4,283 | 2020 |
 Belize | Americas | 4,520 | 2022 | 3,988 | 2020 | 4,436 | 2020 |
 Algeria | Africa | 4,294 | 2022 | 3,368 | 2020 | 3,310 | 2020 |
 Egypt | Africa | 4,162 | 2022 | 3,609 | 2020 | 3,548 | 2020 |
 Vietnam | Asia | 4,122 | 2022 | 2,786 | 2020 | 2,786 | 2020 |
 Micronesia | Oceania | 4,066 | 2022 | 3,500 | 2020 | 3,585 | 2019 |
 Samoa | Oceania | 4,059 | 2022 | 3,890 | 2020 | 4,068 | 2020 |
 Eswatini | Africa | 4,036 | 2022 | 3,306 | 2020 | 3,416 | 2020 |
 Lebanon | Asia | 4,003 | 2020 | 9,310 | 2020 | 4,650 | 2020 |
 Angola | Africa | 3,793 | 2022 | 1,896 | 2020 | 1,896 | 2020 |
 Djibouti | Africa | 3,775 | 2022 | 3,465 | 2020 | 3,426 | 2020 |
 Tunisia | Africa | 3,763 | 2022 | 3,318 | 2020 | 3,320 | 2020 |
 Sri Lanka | Asia | 3,699 | 2022 | 3,768 | 2020 | 3,682 | 2020 |
 Philippines | Asia | 3,687 | 2022 | 3,299 | 2020 | 3,299 | 2020 |
 Palestine | Asia | 3,682 | [n 2]2022 | 3,050 | 2020 | 3,240 | 2020 |
 Morocco | Africa | 3,629 | 2022 | 3,108 | 2020 | 3,009 | 2020 |
 Cape Verde | Africa | 3,503 | 2022 | 3,064 | 2020 | 3,064 | 2020 |
 Bhutan | Asia | 3,491 | 2022 | 3,218 | 2020 | 3,122 | 2020 |
 Bolivia | Americas | 3,431 | 2022 | 3,133 | 2020 | 3,143 | 2020 |
 PapuaNew Guinea | Oceania | 3,269 | 2022 | 2,640 | 2020 | 2,637 | 2020 |
 Congo | Africa | 3,243 | 2022 | 1,830 | 2020 | 1,973 | 2020 |
 Vanuatu | Oceania | 3,145 | 2022 | 2,783 | 2020 | 2,783 | 2020 |
 Ivory Coast | Africa | 2,646 | 2022 | 2,318 | 2020 | 2,326 | 2020 |
 India * | Asia | 2,601 | 2022 | 1,931 | 2020 | 1,901 | 2020 |
 Honduras | Americas | 2,524 | 2022 | 2,406 | 2020 | 2,406 | 2020 |
 Nicaragua | Americas | 2,384 | 2022 | 1,905 | 2020 | 1,905 | 2020 |
 Bangladesh | Asia | 2,362 | 2022 | 2,001 | 2020 | 1,969 | 2020 |
 Nigeria | Africa | 2,356 | 2022 | 2,085 | 2020 | 2,097 | 2020 |
 SolomonIslands | Oceania | 2,334 | 2022 | 2,251 | 2020 | 2,258 | 2020 |
 Laos | Asia | 2,319 | 2022 | 2,623 | 2020 | 2,630 | 2020 |
 São Toméand Príncipe | Africa | 2,315 | 2022 | 2,174 | 2020 | 2,158 | 2020 |
 Ghana | Africa | 2,303 | 2022 | 2,206 | 2020 | 2,329 | 2020 |
 Zimbabwe | Africa | 2,301 | 2022 | 1,466 | 2020 | 1,128 | 2020 |
 Kenya | Africa | 2,252 | 2022 | 1,879 | 2020 | 1,838 | 2020 |
 Mauritania | Africa | 2,141 | 2022 | 1,702 | 2020 | 1,673 | 2020 |
 Uzbekistan | Asia | 2,071 | 2022 | 1,724 | 2020 | 1,686 | 2020 |
 Venezuela | Americas | 1,824 | 2022 | 3,740 | 2020 | 16,056 | 2014 |
 Cambodia | Asia | 1,752 | 2022 | 1,513 | 2020 | 1,513 | 2020 |
 Kiribati | Oceania | 1,745 | 2022 | 1,515 | 2020 | 1,671 | 2020 |
 Haiti | Americas | 1,672 | 2022 | 1,360 | 2020 | 1,177 | 2020 |
 Cameroon | Africa | 1,638 | 2022 | 1,502 | 2020 | 1,499 | 2020 |
 Senegal | Africa | 1,609 | 2022 | 1,458 | 2020 | 1,488 | 2020 |
 Pakistan * | Asia | 1,562 | 2021 | 1,167 | 2020 | 1,194 | 2020 |
 Benin | Africa | 1,432 | 2022 | 1,254 | 2020 | 1,291 | 2020 |
 Guinea | Africa | 1,428 | 2022 | 1,179 | 2020 | 1,194 | 2020 |
 East Timor | Asia | 1,402 | 2022 | 1,443 | 2020 | 1,381 | 2020 |
 Comoros | Africa | 1,371 | 2022 | 1,421 | 2020 | 1,403 | 2020 |
 Zambia | Africa | 1,330 | 2022 | 985 | 2020 | 1,051 | 2020 |
 Kyrgyzstan | Asia | 1,327 | 2022 | 1,186 | 2020 | 1,174 | 2020 |
 Myanmar | Asia | 1,285 | 2022 | 1,292 | 2020 | 1,400 | 2020 |
 Tanzania | Africa | 1,260 | 2022 | 1,115 | [n 3]2020 | 1,077 | 2020 |
 Lesotho | Africa | 1,213 | 2022 | 1,061 | 2020 | 861 | 2020 |
 Afghanistan | Asia | 309 | 2022 | 421 | 2020 | 421 | 2020 |
 Uganda * | Africa | 1,060 | 2022 | 846 | 2020 | 817 | 2020 |
 Ethiopia | Africa | 1,040 | 2022 | 840 | 2020 | 936 | 2020 |
 Zanzibar | Africa | N/a | 1,031 | 2020 | N/a | ||
 Togo | Africa | 1,000 | 2022 | 863 | 2020 | 915 | 2020 |
 Rwanda | Africa | 910 | 2022 | 798 | 2020 | 798 | 2020 |
 Mali | Africa | 897 | 2022 | 856 | 2020 | 859 | 2020 |
 Yemen | Asia | 891 | 2022 | 937 | 2020 | 824 | 2018 |
 Syria | Asia | 891 | 2010 | 890 | 2020 | 641 | 2007 |
 Burkina Faso | Africa | 886 | 2022 | 831 | 2020 | 831 | 2020 |
 Guinea-Bissau | Africa | 873 | 2022 | 668 | 2020 | 728 | 2020 |
 Gambia | Africa | 844 | 2022 | 757 | 2020 | 787 | 2020 |
 Tajikistan | Asia | 795 | 2022 | 838 | 2020 | 859 | 2020 |
 Liberia | Africa | 776 | 2022 | 491 | 2020 | 583 | 2020 |
 Chad | Africa | 743 | 2022 | 679 | 2020 | 615 | 2020 |
 Eritrea | Africa | 701 | 2022 | 588 | 2020 | 643 | 2011 |
 Sudan | Africa | 674 | 2022 | 1,415 | 2020 | 596 | 2020 |
 DR Congo | Africa | 669 | 2022 | 506 | 2020 | 557 | 2020 |
 North Korea | Asia | N/a | 618 | 2020 | N/a | ||
 Nepal | Asia | 611 | 2020 | 508 | 2020 | 509 | 2020 |
 Niger | Africa | 599 | 2022 | 568 | 2020 | 421 | 2020 |
 Mozambique | Africa | 547 | 2022 | 449 | 2020 | 449 | 2020 |
 Malawi | Africa | 545 | 2022 | 615 | 2020 | 625 | 2020 |
 Somalia | Africa | 544 | 2022 | 118 | 2020 | 309 | 2020 |
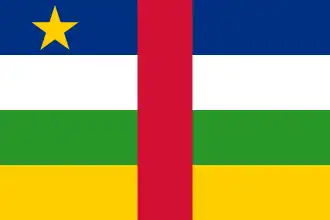 Central AfricanRepublic | Africa | 527 | 2022 | 481 | 2020 | 477 | 2020 |
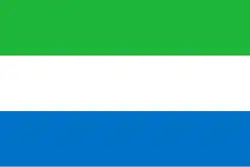 Sierra Leone | Africa | 513 | 2022 | 475 | 2020 | 485 | 2020 |
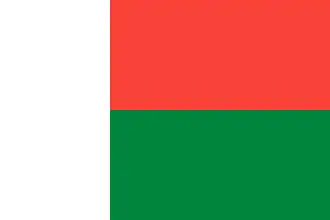 Madagascar | Africa | 504 | 2022 | 470 | 2020 | 496 | 2020 |
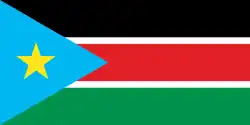 South Sudan | Africa | 393 | 2022 | 1,421 | 2020 | 1,120 | 2015 |
 Burundi | Africa | 272 | 2022 | 286 | 2020 | 274 | 2020 |
Note: Data unavailable for the Falkland Islands, the Faroe Islands, Gibraltar, Guernsey, the Holy See (Vatican City), the Isle of Man, Jersey, Niue, the Pitcairn Islands, Saint Helena, Ascension and Tristan da Cunha, Tokelau, the United States Virgin Islands, and Western Sahara.
Distorted GDP-per-capita for tax havens
Many of leading GDP-per-capita (nominal) jurisdictions are tax haven's whose economic data is artificially inflated by tax-driven corporate accounting entries.
For instance, the Irish GDP data above is subject to material distortion by the tax planning activities of foreign multinationals in Ireland. To address this, in 2017 the Central Bank of Ireland created "Modified gross national income|modified GNI" (or GNI*) as a more appropriate statistic, and the OECD and IMF have adopted it for Ireland. 2015 Irish GDP is 143% of 2015 Irish GNI*.
A stunning $12 trillion—almost 40 percent of all foreign direct investment positions globally—is completely artificial: it consists of financial investment passing through empty corporate shells with no real activity. These investments in empty corporate shells almost always pass through well-known tax havens. The eight major pass-through economies—the Netherlands, Luxembourg, Hong Kong SAR, the British Virgin Islands, Bermuda, the Cayman Islands, Ireland, and Singapore—host more than 85 percent of the world’s investment in special purpose entities, which are often set up for tax reasons.
Further discussion on this topic can be found in the List of countries by GDP (PPP) per capita article.
Related pages
- List of countries by GDP (nominal)
- List of IMF ranked countries by GDP, IMF ranked GDP (nominal), GDP (nominal) per capita, GDP (PPP), GDP (PPP) per capita, Population, and PPP
- List of countries by average wage
- List of countries by external debt
Notes
- ↑ Based on the IMF data. If no data was available for a country from IMF, data from the World Bank is used
References
- ↑ O'Sullivan, Arthur
- ↑ French President seeks alternatives to GDP, The Guardian 14-09-2009.
"European Parliament, Policy Department Economic and Scientific Policy: Beyond GDP Study" (PDF). Archived from the original (PDF) on 2012-10-30. Retrieved 2021-04-13. (1.47 MB) - ↑ "World Economic Outlook Database, April 2022". IMF.org. International Monetary Fund. 19 April 2022. Retrieved 19 April 2022.
- ↑ "World Economic Outlook Database, April 2022". IMF.org. International Monetary Fund. 19 April 2022. Retrieved 19 April 2022.
- ↑ , (Select all countries, "GDP, Per Capita GDP - US Dollars", and "2020" to generate the table), United Nations Statistics Division. Access date: 29 January 2022.
- ↑ "GDP per capita (current US$)". World Development Indicators. World Bank. Retrieved 28 June 2021.
- ↑ "GDP: Preliminary estimate for 2021 Q1 and outlook for 2021" (PDF). eng.stat.gov.tw. Archived from the original (PDF) on 2021-07-06. Retrieved 2021-07-02.
- ↑ "國民所得統計摘要" (PDF). eng.stat.gov.tw (in Chinese (Taiwan)). Archived from the original (PDF) on 2021-07-06. Retrieved 2021-07-02.
- ↑ "Piercing the Veil, FINANCE & DEVELOPMENT, JUNE 2018, VOL. 55, NO. 2". IMF Finance & Development. June 2018.
Other websites
- Chart of GDP per capita at current US$ prices by Google, World Bank data
- World Map and Chart of GDP per capita at current prices by Lebanese-economy-forum, World Bank data