California's 1st congressional district
| California's 1st congressional district | |||
|---|---|---|---|
Interactive map of district boundaries since 2023 (Used in the 2022 elections) | |||
| Representative |
| ||
| Population (2022) | 758,561[1] | ||
| Median household income | $64,471[2] | ||
| Ethnicity |
| ||
| Cook PVI | R+12[3] | ||
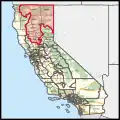
California's 1st congressional district is a congressional district in the U.S. state of California. The seat has been represented by Republican U.S. Representative James Gallagher following the death of Doug LaMalfa in 2026. Before LaMalfa, the district had not had a Republican congressman since 1998.
The district is made up of the counties: Butte County, Lassen County, Modoc County, Plumas County, Shasta County, Sierra County, Siskiyou County, Tehama County, most of Nevada County, part of Glenn County and part of Placer County.[4]
Election history
| Party | Candidate | Votes | % | |
|---|---|---|---|---|
| Democratic | Mike Thompson (Incumbent) | 189,336 | 67.0 | |
| Republican | Lawrence R. Wiesner | 79,970 | 28.2 | |
| Green | Pamela Elizondo | 13,635 | 4.8 | |
| Total votes | 282,941 | 100.0 | ||
| Turnout | ||||
| Democratic hold | ||||
| Party | Candidate | Votes | % | |
|---|---|---|---|---|
| Democratic | Mike Thompson (Incumbent) | 144,409 | 66.3 | |
| Republican | John W. Jones | 63,194 | 29.0 | |
| Green | Pamela Elizondo | 6,899 | 3.1 | |
| Peace and Freedom | Timothy J. Stock | 3,503 | 1.6 | |
| Total votes | 218,044 | 100.0 | ||
| Turnout | ||||
| Democratic hold | ||||
| Party | Candidate | Votes | % | |
|---|---|---|---|---|
| Democratic | Mike Thompson (Incumbent) | 154,006 | 68.2 | |
| Republican | Zane Starkewolf | 53,561 | 23.7 | |
| Green | Carol Wolman | 18,492 | 8.1 | |
| Total votes | 226,059 | 100.00 | ||
| Turnout | ||||
| Democratic hold | ||||
| Party | Candidate | Votes | % | |
|---|---|---|---|---|
| Democratic | Mike Thompson (Incumbent) | 136,605 | 62.8 | |
| Republican | Loren Hanks | 67,217 | 31.1 | |
| Green | Carol Wolman | 7,576 | 3.6 | |
| Libertarian | Mike Rodrigues | 5,484 | 2.5 | |
| Total votes | 216,882 | 100.0 | ||
| Turnout | ||||
| Democratic hold | ||||
| Party | Candidate | Votes | % | |
|---|---|---|---|---|
| Republican | Doug LaMalfa | 168,827 | 57.4 | |
| Democratic | Jim Reed | 131,548 | 42.6 | |
| Total votes | 294,213 | 100.0 | ||
| Turnout | ||||
| Republican hold | ||||
| Party | Candidate | Votes | % | |
|---|---|---|---|---|
| Republican | Doug LaMalfa (Incumbent) | 132,052 | 61.0 | |
| Democratic | Heidi Hall | 84,320 | 39.0 | |
| Total votes | 216,372 | 100.0 | ||
| Turnout | ||||
| Republican hold | ||||
| Party | Candidate | Votes | % | |
|---|---|---|---|---|
| Republican | Doug LaMalfa (Incumbent) | 185,338 | 59.1 | |
| Democratic | Jim Reed | 128,588 | 40.9 | |
| Total votes | 314,036 | 100.0 | ||
| Turnout | ||||
| Republican hold | ||||
| Party | Candidate | Votes | % | |
|---|---|---|---|---|
| Republican | Doug LaMalfa (Incumbent) | 160,046 | 54.9 | |
| Democratic | Audrey Denney | 131,548 | 45.1 | |
| Total votes | 291,594 | 100.0 | ||
| Turnout | ||||
| Republican hold | ||||
| Party | Candidate | Votes | % | |
|---|---|---|---|---|
| Republican | Doug LaMalfa (Incumbent) | 128,613 | 54.6 | |
| Democratic | Audrey Denney | 92,655 | 39.4 | |
| Democratic | Rob Lydon | 8,745 | 3.7 | |
| Independent | Joseph LeTourneau IV | 2,769 | 1.2 | |
| Independent | Gregory Edward Cheadle | 2,596 | 1.1 | |
| Republican | Kenneth E Swanson (write-in) | 13 | 0.0 | |
| Total votes | 235,391 | 100.0 | ||
| Party | Candidate | Votes | % | |
|---|---|---|---|---|
| Republican | Doug LaMalfa (incumbent) | 204,190 | 57.0 | |
| Democratic | Audrey Denney | 154,073 | 43.0 | |
| Total votes | 358,263 | 100.0 | ||
| Republican hold | ||||
References
- ↑ "CA 2022 Congressional". Dave's Redistricting. 2022-01-04. Retrieved 2022-11-11.
- ↑ Center for New Media & Promotion (CNMP). "My Congressional District". US Census Bureau. Retrieved 2023-10-05.
- ↑ "2022 Cook Partisan Voting Index (Cook PVI) District Map". Cook PVI. Retrieved 8 January 2023.
- ↑ "Maps: Final Congressional Districts". Citizens Redistricting Commission. Archived from the original on 2013-03-10. Retrieved February 24, 2013.
- ↑ 2004 election results
- ↑ 2006 election results
- ↑ 2008 election results
- ↑ 2010 election results
- ↑ 2012 election results
- ↑ 2014 election results
- ↑ 2016 election results
- ↑ 2018 election results
- ↑ 2020 primary results